Writings · Index
Analysis for the Australian Energy Council: battery equity, OECD price benchmarking, and the quarterly Solar Report.
The full articles are on energycouncil.com.au. Filter by topic, type or year; each card links to the original.
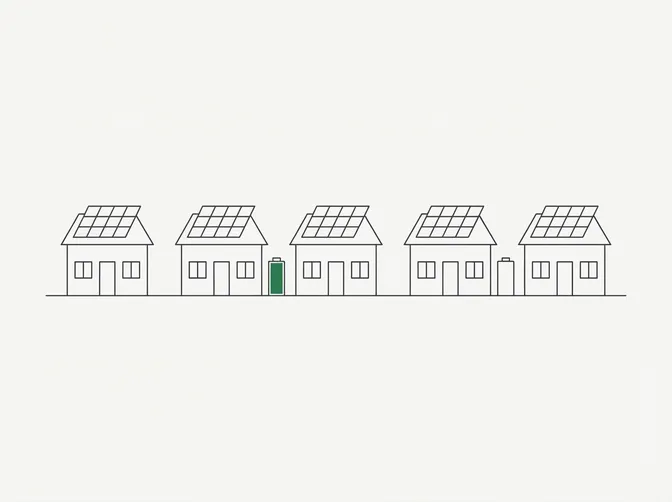
Australia’s Home Battery Surge: A Question of Equity
Australia is a global leader in rooftop solar, with more than 4.3 million households and small businesses installing photovoltaic (PV) systems as of February 2026. Battery uptake has also accelerated, particularly since the introduction of the Cheaper Home Batteries Program in July 2025, which offers around a 30 per cent upfront discount for systems between 5 kWh and 100 kWh.
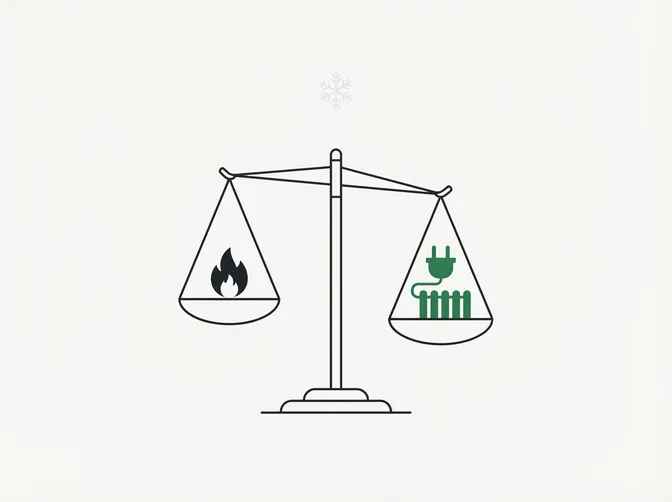
Winter Bills: Is it cheaper to heat your house with gas or electricity?
As gas and electricity prices continue to fluctuate across Australia’s east coast, households and businesses are facing rising winter energy costs and growing uncertainty. Seasonal demand, household gas consumption, and the efficiency of electric heating systems, particularly when paired with rooftop solar, are playing an increasingly important role in shaping energy bills.
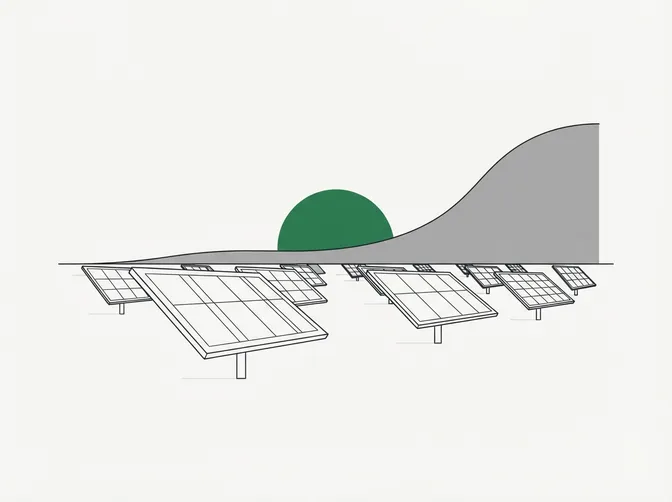
Solar Report: Second Quarter 2025
Quarterly snapshot of rooftop solar capacity, payback periods and LCOE. More than 4.1 million PV systems installed nationwide as of mid-2025, with a 25-year retrospective on the Renewable Energy (Electricity) Act 2000 and the REC market that followed.
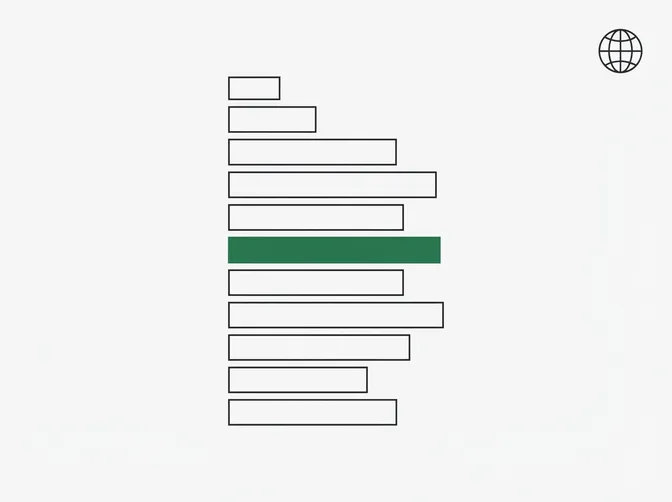
OECD Price Comparison: How do we stack up?
As households and small businesses are notified of changes to their energy prices for the financial year, there continues to be scrutiny of our power prices. With energy affordability an ongoing concern for Australians, comparisons with overseas energy markets are common with consideration of how Australia's costs compare to other countries.
Twenty-Five Years of Rooftop Solar: Who were the Pioneers?
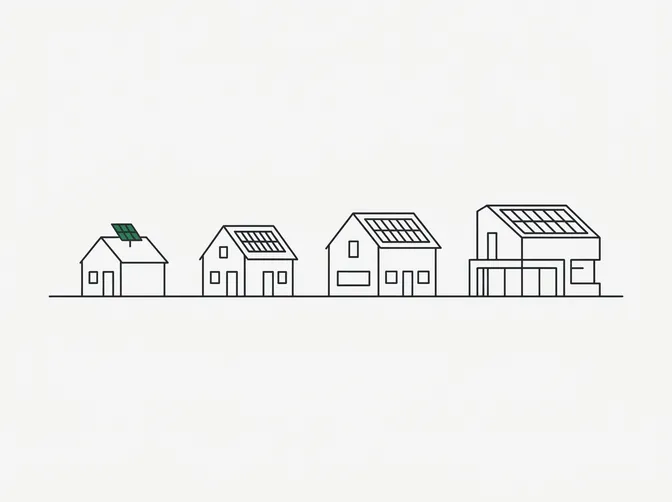
Australia’s energy landscape has transformed dramatically over the past 25 years, driven in part by the Renewable Energy (Electricity) Act 2000 and the introduction of renewable energy certificates in 2001. Through the Small-scale Renewable Energy Scheme, households have been incentivised to install rooftop solar with the help of Small-scale Technology Certificates (STCs).
Solar Report: First Quarter 2025
Quarterly market snapshot covering rooftop PV capacity (26.7 GW, 4.15M systems), state-by-state install rates, system size trends and payback economics for residential and small-business systems.

Gas and hydro: Back-up in action
The first quarter of 2021 for the NEM's spot market was notable for its lack of notability. But in a measure of the how the NEM can turn, the Q2 Queensland average price to date is $135.83/MWh, versus $42.64/MWh over Q1.
Western Australia’s dramatically changing electricity consumption
Recent data from the AEMO shows that demand and consumption in Western Australia has changed markedly from last year.
NEM demand in the time of COVID-19
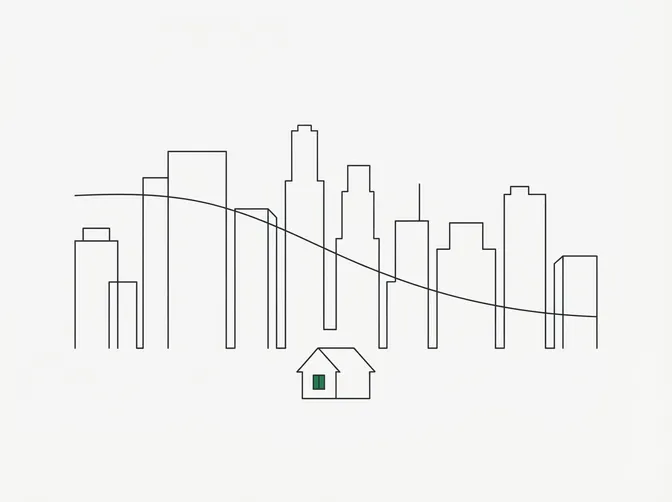
Australia’s COVID-19 response, with lockdowns between and within the states, means many of the nation’s economic activities have encountered new challenges, with many people working from home with commercial premises empty.
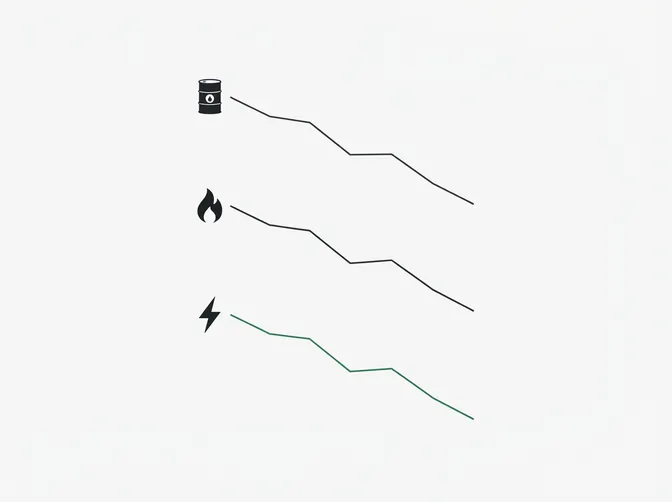
Gas and wholesale prices: A market at work
Changes in global oil prices have had a knock-on effect for gas prices in areas. At the same time recent dramatic falls in NEM electricity prices have followed the domestic gas market which has in turn followed the world hydrocarbon market. This demonstrates these markets is working competitively and as expected.

The emergence of a new energy market dynamic
Discussion about the emergence of a new energy market dynamic and whether there is a need to address it, has recently developed in the public arena.
Read on energycouncil.com.au
Germany: Renewables rise as share of greenhouse gas emissions plateau
Recent data that looks at Germany’s greenhouse gas emissions shows that despite the country’s renewable energy in the energy sector growing, the share of emissions from the sector has remained relatively flat.
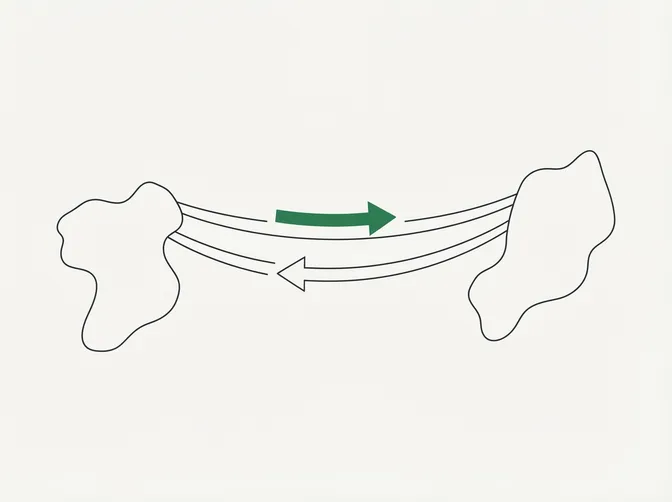
Electricity exports: What did the NEM do last summer?
With the close of summer, a media report was quick to highlight that New South Wales power stations had “kept the lights on in Victoria” [i]. This was the first summer in which Victoria did not have access to the 1600MW of baseload generation provided by the Hazelwood brown-coal fired power station, which closed in March 2017.
Capacity factors: Understanding the misunderstood
With the current debate about the future of the Liddell Power Station in New South Wales, some media have focused on the plant’s capacity factor.
Solar Report - March 2017
While the trend for solar PV system installations has remained fairly flat since January 2016 the average unit size has increased. Cumulative installed capacity for solar PV in Australia stood at 5500 MW with more than 1.65 million installations at February 2017. Our Solar report looks at the latest trends and projections.
Renewables on a new trajectory
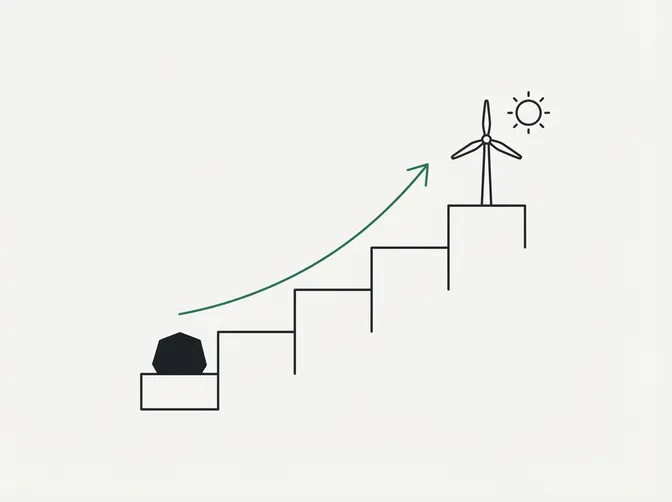
The International Energy Agency (IEA)’s latest report, the Medium Term Renewable Energy Market Report 2016, provides a forecast of renewable energy growth over the next six years. With renewable energy overtaking coal in terms of net annual additions to installed power capacity in the world for the first time in 2015.
Worldwide electricity prices: How does Australia compare?
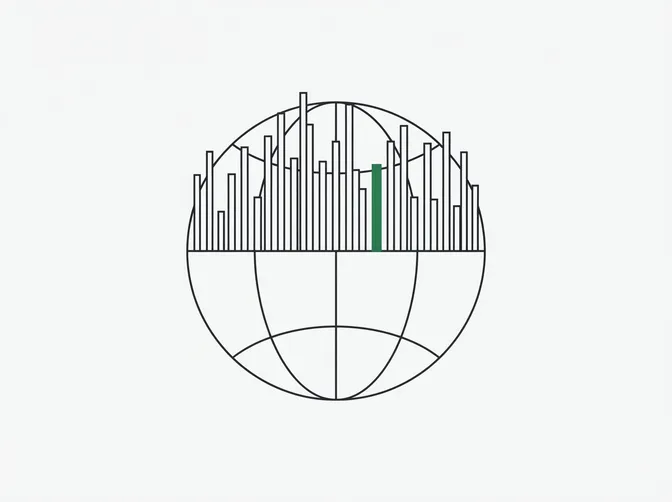
According to the Energy in Australia 2015 report Australia's power prices were lower than the OECD average and were low by overall international standards. With a gap of 29 US c/kWh between the least and most expensive OECD economies power prices, how does Australia compare?