Case study · Customer churn
Evidence from 1,869 exit interviews: Why customers left
Most companies know exactly who cancelled and can only guess at why. This analysis uses a dataset in which nobody has to guess: 7,043 telecom customers, with a recorded reason for every one of the 1,869 who left. Price, the reason companies usually reach for first, ranks fourth. The most common single answer is the attitude of a support person, and the behavioural records point the same way: churn concentrates where the commitment is short, where staying takes monthly effort, and in the first year of the relationship.
Churn is the industry word for customers closing their accounts and leaving a business. Retention teams study this metric closely because winning a new customer costs far more than keeping an existing one. However, the records those teams work from (bills, contracts, usage) say who left and stay silent on why, because in most companies nobody asks the leavers, or nobody writes the answer down.
This article is the companion to my analysis of churn at an energy retailer, which had exactly that limitation: real churn outcomes and no recorded reasons. Here the data is the exception. IBM’s Telco customer churn sample covers 7,043 telephone and internet customers, 26.5% of whom left in the observation window, and every leaver has a stated reason on record, 20 distinct answers in all. Section 1 tallies those reasons. Sections 2 to 4 check the reasons against recorded behaviour: the contract and how the customer pays, the product tier and support cover, and the age of the relationship. Section 5 asks whether a model could have flagged the leavers in advance. Finally, sections 6 and 7 recommend five experiments and note the limits of this analysis.
Findings at a glance
Price ranks fourth.
A third of leavers named a competitor and a quarter named product or service quality. Price and charges cover 13% of leavers. The single most common answer in the file, given by 192 people, is the attitude of a support person.
The shorter the commitment, the higher the churn.
Month-to-month customers leave at 42.7%, one-year customers at 11.3% and two-year customers at 2.8%. Part of the gap is self-selection, but a fifteen-fold difference suggests the contract itself is doing work.
Manual payment predicts leaving.
Customers who pay by electronic check each month leave at 45.3%, against roughly 16% on automatic payment. The product is identical; the monthly decision moment is the difference.
The premium product churns hardest.
Fibre customers hold the objectively better product and leave at 41.9%, more than twice the 19% of DSL customers. Internet customers without a tech support add-on leave at 41.6%, against 15.2% with it.
The first year decides most of it.
Over half of all leavers (55.5%) go within their first year. The median leaver lasts ten months; the median stayer is at 38 months and counting.
What did 1,869 leavers say when asked?
This section tallies the answers that the rest of the article is built on.
Each leaver in the file has exactly one recorded reason, drawn from 20 standard answers. Twenty categories are too many to reason about, so I grouped them by hand into six themes: competitor pull, product and service quality, how customers were treated, price and charges, life circumstances, and no stated reason. The chart below keeps both levels visible so the grouping can be checked.
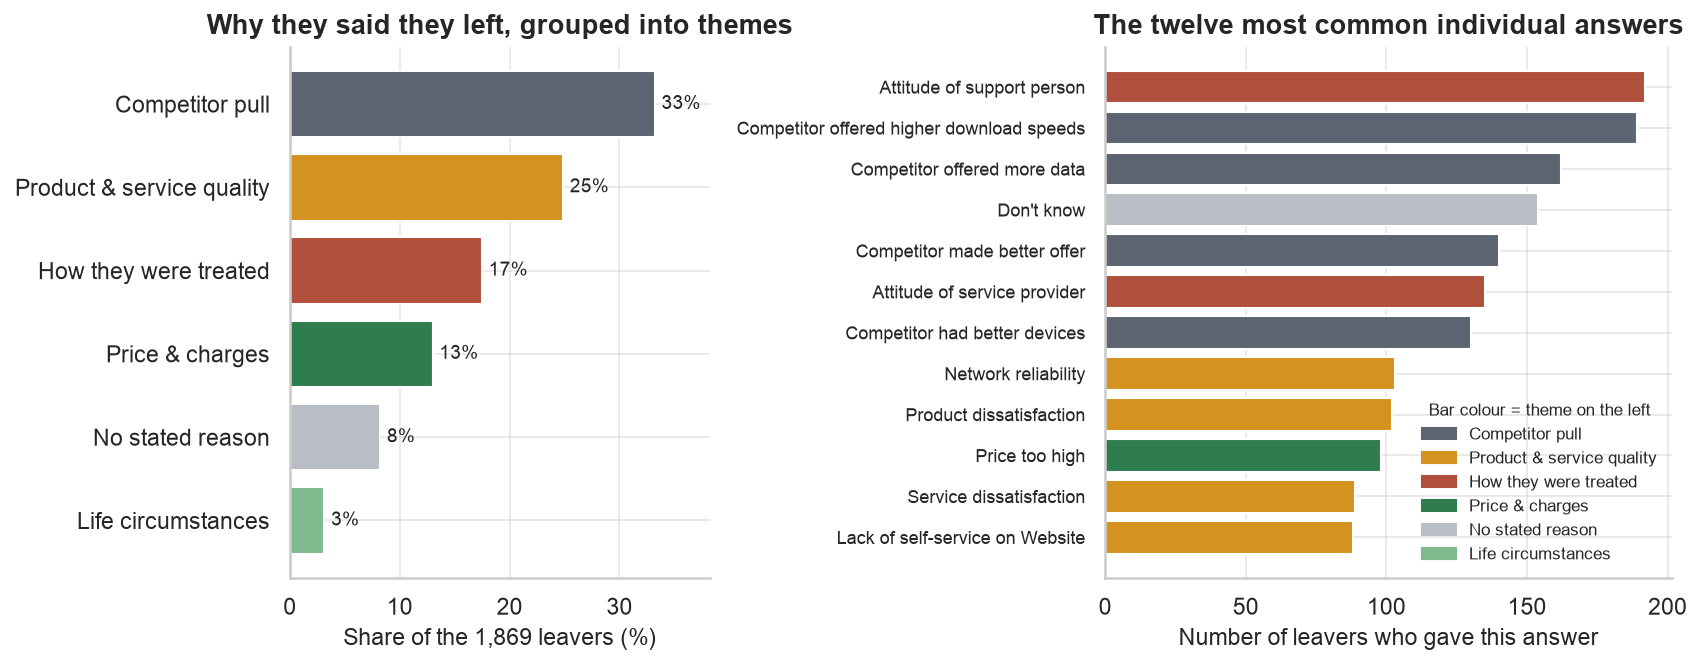
A third of leavers (33.2%) named a competitor: better speeds, more data, better devices, a better offer. A quarter (24.9%) pointed at product and service quality, answers like network reliability and dissatisfaction with the service itself. Price and charges, the theory most retention plans are built on, came fourth, named by 13% of leavers.
Furthermore, 17.5% of leavers, about one in six, gave a reason that was neither product nor price: they left over how they were treated. The single most common specific answer in the entire file, ahead of every speed, device and dollar figure, is the attitude of a support person, given by 192 people. When I first ran the tally I assumed I had grouped something incorrectly; I had not. Adding the attitude of the provider itself, the treated-badly answers outweigh every price and charge complaint combined.
Still, stated reasons deserve some suspicion. They are collected after the decision, and people rationalise. Thus, the next three sections check whether the recorded behaviour in the same file agrees with what the leavers said. It does.
Does the length of the commitment matter?
The first behavioural check covers contract length and payment method.
If the stated reasons are real, they should show up in behaviour. The loudest pattern in the file is contract type, and next to it sits a quieter version of the same mechanism: how the customer pays each month.
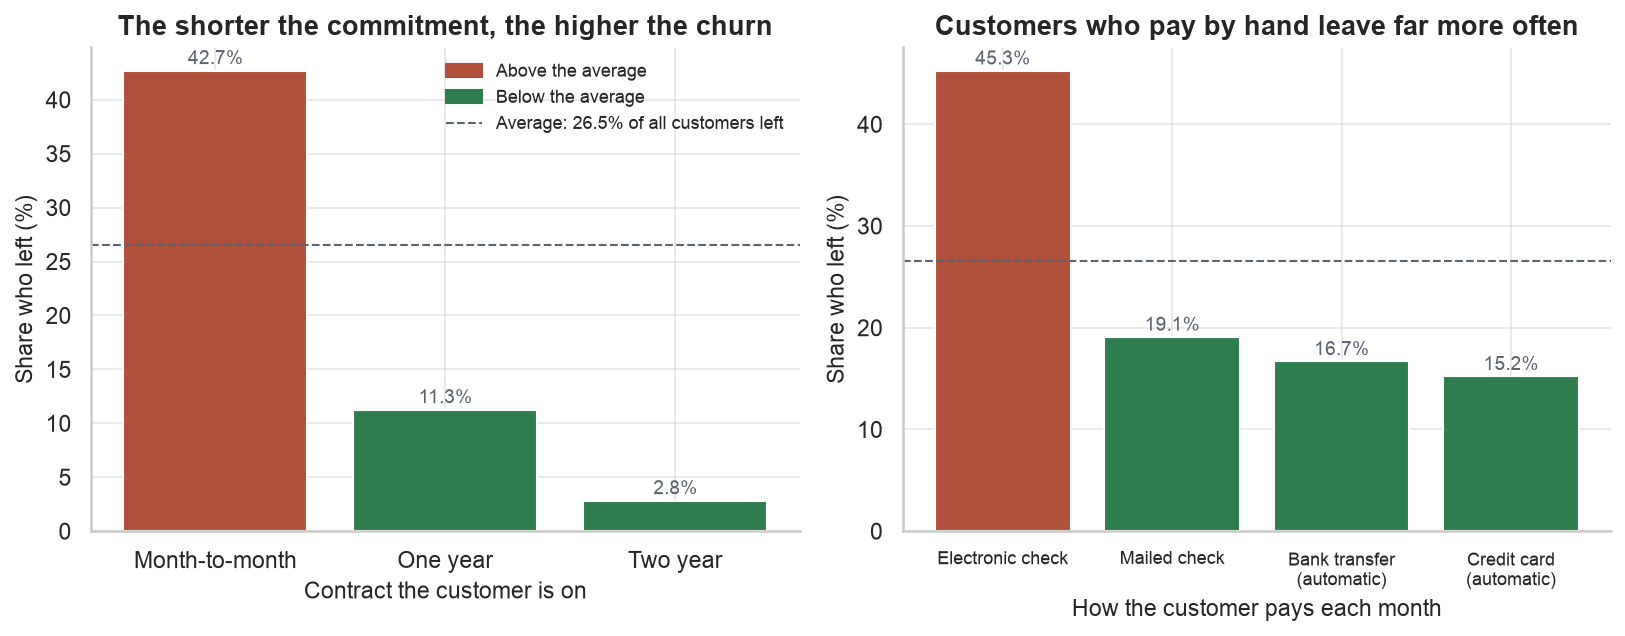
First, commitment. Month-to-month customers leave at 42.7%, one-year customers at 11.3%, and two-year customers at 2.8%. Part of this is self-selection, since customers who expect to move choose flexible contracts, but a fifteen-fold gap suggests more than selection. A long contract takes the leaving decision off the table, while the month-to-month customer decides to stay every four weeks, and every decision is a chance to act on dissatisfaction.
Second, payment friction. Customers who pay by electronic check, a manual action every month, leave at 45.3%. Customers on automatic bank transfer or credit card leave at roughly 16%. The product is identical; the difference is that one group asks themselves every month whether they still want to pay, while the other set the decision once. It should be noted that payment method also correlates with age and digital comfort, so this pattern should be held loosely. Still, the direction is consistent with everything else in the file, since manual payment adds one more moment each month at which the customer can reconsider.
Why does the premium product churn hardest?
The second check compares what was promised with what was delivered.
Fibre broadband is the better product on every specification, and fibre customers leave at 41.9%, more than twice the 19% of DSL customers. The likely explanation is that a premium product carries premium expectations: satisfaction depends on the gap between what was promised and what was delivered, and a higher price leaves more room for disappointment. This is consistent with the reasons tally, where product and service quality is the second largest theme.
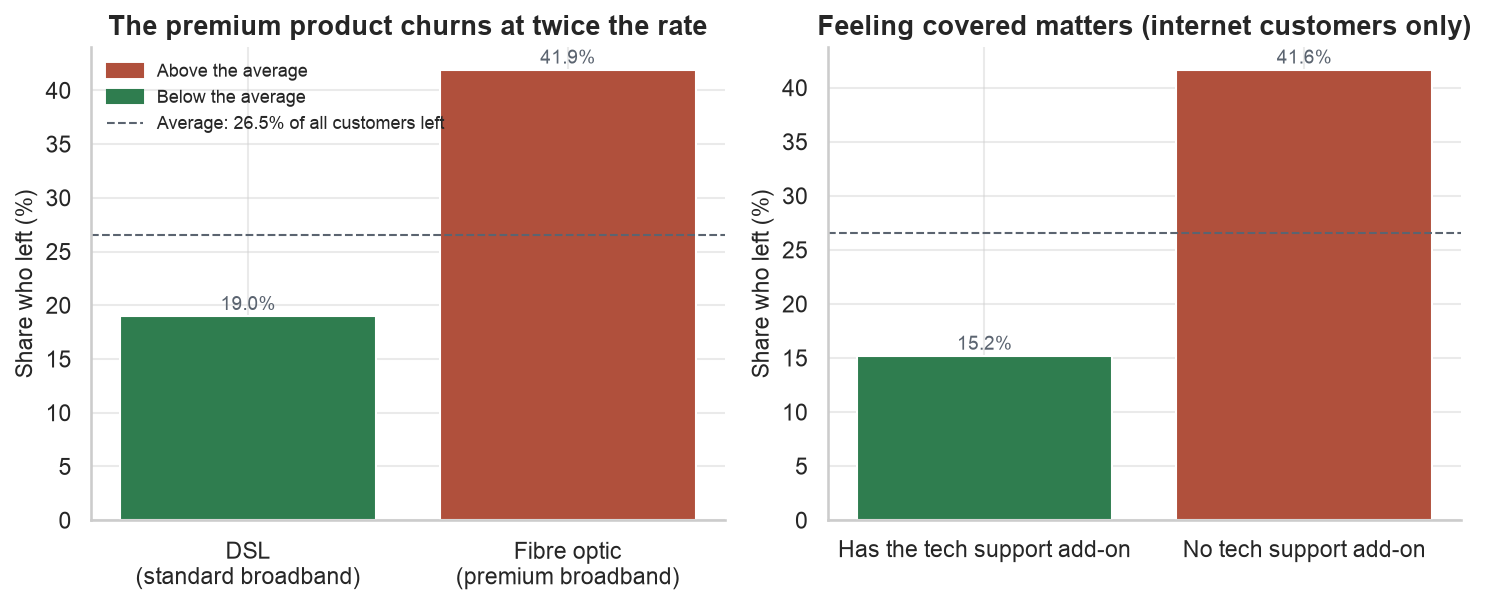
The right chart shows the other half of the pattern. Internet customers with a tech support add-on leave at 15.2%, against 41.6% without one. Customers who buy the add-on may differ in other ways, so this reading should also be held loosely. However, it fits the exit answers, where unhelpful support and poor expertise appear over and over: the difference appears to be less about the support tickets themselves and more about whether the customer feels covered when something breaks.
When in the relationship do customers leave?
The timing pattern is the strongest in the file, and it is the one that carries across industries.
Over half of all leavers (55.5%) go within their first year. The median leaver lasts ten months, while the median stayer has been with the company for 38 months and counting. Grouped by relationship age, churn falls from 47.4% among first-year customers to 6.6% among customers past their fifth year.
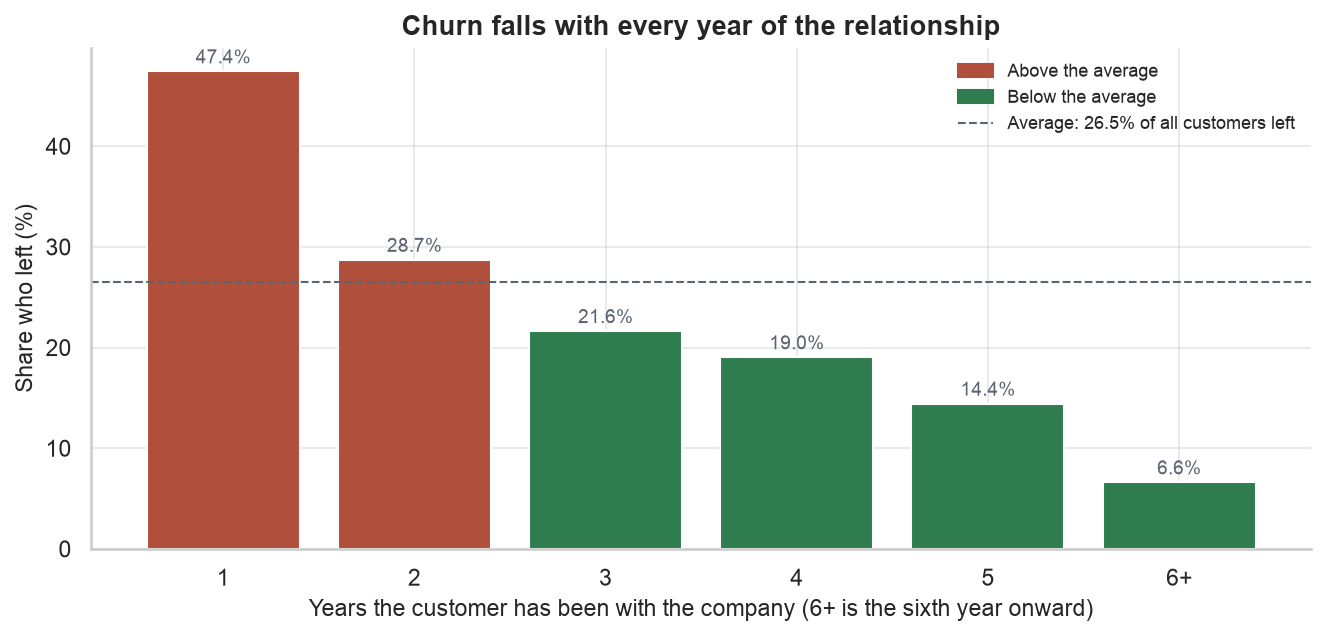
The shape of this curve is not unique to telecom. The companion analysis of an energy retailer found the same steep-then-flat pattern at much lower levels, in a different industry on a different continent. The first year appears to be where the relationship either settles or does not: habits form, automatic payment gets set up, and the customer stops shopping around.
In other words, retention effort spread evenly across the customer base arrives mostly after the risky period has passed.
Can the leaving be predicted?
This is a brief check, run mainly for what it says about the patterns above.
To test whether these patterns add up to a usable early warning, I trained two models on three quarters of the customers and graded them on the quarter they had never seen: a logistic regression (the straightest possible line through the data, and the simple baseline) and gradient boosting (a family of decision trees that can capture bends). The stated reason was excluded from the inputs, since it only exists after a customer has left, and so was the vendor’s own pre-computed churn score, for the same reason.
The two models effectively tie, at 0.856 against 0.858 test AUC (a 0-to-1 score for how well a model ranks leavers ahead of stayers, where 0.5 is no better than random). The tie is itself informative: once contract type, tenure and charges are known, few bends remain for the trees to find, so the simpler model is the sensible production choice here. In the energy companion the tree models won clearly on the same test. Thus, which model wins depends on the problem rather than the algorithm, and the only way to know is to run the simple baseline every time.
What should the business do next?
Five experiments follow, in the order I would run them.
The patterns above are strong, and still none of them prove cause and effect: customers who chose two-year contracts may simply be the kind of customers who stay. One approach to bridge that gap is to perform A/B testing. In an A/B test, a group of customers is split at random, one thing is changed for half of the group, and the other half is left alone; churn is then compared a few months later. The random split is what makes the comparison fair, because both halves contain the same mix of everything else. Each experiment below names its change, its audience and its measure.
Make automatic payment the default
Customers who pay manually each month leave at 45.3%, against roughly 16% on automatic payment. Part of that gap is self-selection, so it should be tested: offer a random half of manual payers a one-click switch with a small once-off credit, and compare churn after six months.
Treat support conversations as retention work
One in six leavers said they left over how they were treated, more than the number who named price. Select a random half of customers who recently had a complaint or a poor support contact, give them a trained follow-up call within two days, and compare churn against the untouched half.
Improve the first year of the relationship
Over half of all leavers never reach a second year. Give a random half of new customers a check-in before their first bill and an early follow-up on their first fault or complaint, then compare churn at twelve months against the untouched half.
Offer a reason to commit for longer
Month-to-month customers leave at 42.7%, against 2.8% on two-year contracts. Some of that is who chooses which contract, so the offer needs a test: give a random half of month-to-month customers a modest incentive to move to a one-year term, count the incentive as a cost, and compare churn at twelve months.
Trial the tech support add-on at no charge
Internet customers without the add-on leave at 41.6%, against 15.2% with it. Give a random half of customers without it three months of the add-on free, then compare churn and paid take-up once the trial ends.
What this analysis cannot tell us
These caveats apply to every number above.
First, the exit reasons are self-reported after the decision, and people rationalise; 8.2% of leavers answered “don’t know”, which suggests the remaining answers should also be read with some care. Each leaver also records exactly one reason, so a customer who was treated poorly and then found a better offer appears under a single heading. Second, the behavioural patterns carry confounds I cannot fully unpick in this file: payment method correlates with age and digital comfort, and contract choice with how settled a customer expects to be. Third, this is one telecom provider in one observation window, so the shares should be read as one company’s answer rather than an industry constant, and how far the findings carry into other subscription businesses is an argument rather than a proof; the energy companion article uses them only as supporting evidence. Finally, none of the patterns here are causal until the experiments run, which is why every recommendation above is phrased as a test with a control group.